Our Ecological Economic equation accounts for how we can actively protect and restore our ecological biodiversity. Rather than simply give value to what we extract, we can also account for the cost of environmental damage, our food and water security and our well being.
The Intemerate Working Group for Data Statistics and Valuation
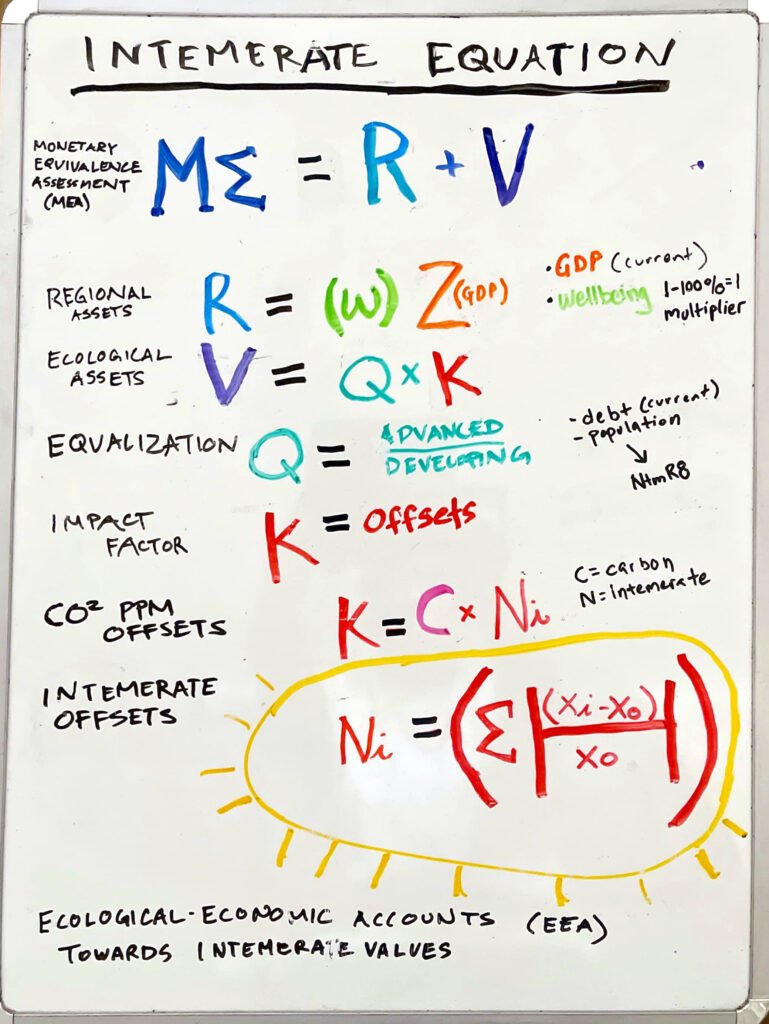
In our Intemerate Equation, MEA, or the Monetary Equivalence Assessment (M∑) is the measurement of an economy’s Regional Accounts (R) and our Ecological Assets (V).
The GDP (Z) that makes up the Regional Assets (R) is modulated by a country’s Wellbeing Indicators (w).
Ecological Assets (V) are determined by Equalization (Q) and the Impact Factor (K).
Equalization is a scheme that leverages factors like debt, population, investment indices, payment schemes or infrastructure financing through global development initiatives to equalize the valuation of our ecological data.
The Impact factor (K) is a measure of the Carbon Offsets (C) against the 350 ppm baseline, as well the Intemerate Offsets (N).
What is measured by intemerate offsets are the measurable factors of restoring our ecological biodiversity.
The Intemerate Equation is a tangible thing. It is something to hold, to plant in the soil, to return to the Eternal, it is something to give value to life.

Our equation really begins with Wellbeing (w). While there are many methodologies for measuring wellbeing, how we measure is determined by communities and/or states and should not be institutionalized by international standards. Examples of local methodologies (here, here, and here) can be quantified by its relative change and relative difference and aggregated into values represented by the variable (w), this is a process that will have to be determined by local statistical offices, and how those values are accounted for must be dependent on local practices.
High GDP countries are likely to have a very different standard than Low GDP countries. How we measure wealth, racial and gender disparities, access to health, labor, affordable financing, infrastructure, household work, and the security of our environmental resources are pillars that make up the foundation for wellbeing.
Wellbeing is measured from .1 to 1, with 100% fulfillment of wellbeing accounted as “1,” and the lowest of wellbeing factors measuring 1%, or “.1.” Wellbeing is essential because of how it modulates GDP.

At its infancy, GDP (Z) was an innocent measurement of production, consumption, distribution and exchange of goods and services. It was a standard by which all countries would measure their economic outputs. When standards were agreed upon in 1953, it was a system originally designed to benefit new countries born out of the era of decolonization.
Over time, as GDP grew into adolescence, how those outputs were valued began to privilege the strengths of the dominant former colonial administrators, while excluding the wealth and natural capital of the former colonies, despite the fact that the accumulated wealth of the “advanced” economies accounted for the natural resource wealth and labor of “developing” countries.
As GDP matured into adulthood, the dollar (Z$) enforced its rule-making exceptions and the benign concept of economic cooperation became a belligerent global tool for maintaining unipolar advantages in economic development at the expense of developing countries, the non-aligned countries and our global environmental security.
Z$ institutionalized the OECD, the Organization of Economic Cooperation and Development, the economic counterpart to NATO.

Wellbeing (w) is a multiplier of GDP (Z), and the product is our Regional Assets (R). Wellbeing modulates our GDP, so that we can maximize the factors that can benefit low performing economies, indigenous, poor and impacted communities that have been excluded by GDP.
While it should be an aspiration for our Wellbeing to be measured at 100%, our Regional Assets will likely be of a lower value than our GDP. How much lower will be dependent on those factors like access to health, infrastructure, and the other conditions and disparities that make up (w).
The product of our Regional Assets is not the final Monetary Equivalence Assessment (M∑) since it is a sum of our Regional Assets (R) and our Ecological Assets (V).
Regional Assets is a big fish that holds the industrial accounting wealth of our GDP, but when you factor in Wellbeing, the economic gains are incomplete, as they are neither just, fair nor equitable.

As the international trade currency, the U.S. economy (Z$) has had a privileged position in the global economy. How this happened is a result of a number of factors, but much of it can be reduced to the post-WW2 economic development under the Marshall Plan which subsequently led to the establishment of the OECD (then OEEC) in 1948 with 20 countries, mostly European.
The OECD is a group of free-market economies, that upon its inception were the former colonizing countries cooperating to maintain their administrative and economic influence with the newly formed governments.
As the self-proclaimed advanced economies of the “first-world,” they militarized an Iron Curtain against the socialist-oriented countries that promoted self-determination. They cooperated by obstructing economic relationships that did not prioritize the industrial or commercial interactions of free-market economies by imposing free trade rules giving greater rights to investors and corporations than protections for people and environments.
Submitting to the ratification of the 1946 UN Charter, these old administrating powers were mandated under a Sacred Trust to list their territories with the UN for the promotion of self-government.
Understanding that there could be no peace as long as colonialism were were a part of the global system, most countries willingly obliged. However upon the establishment of the OECD, post-colonial ambitions enforced a different kind of global order that facilitated an antagonistic global system between Socialism and Free Market Capitalism.

While another grouping of the 77 non-aligned countries emerged under the UN system in 1964 and evolved as UNCTAD, the ACP (Africa, Caribbean, Pacific) grouping was chartered with the EU in 1975, focusing on sustainable economic and environmental development.The ACP-EU recognized the historical conditions for regional economic disparities and the objectives for promoting a more just and equitable international order.
The GDP (Z) ACP+ represents unjust, unfair and inequitable ways through which the OECD economies (including the World Bank and IMF) reinforced their own priorities at the expense of entire regions and peoples.
National Accounting revisions requires that the Z(ACP+) not be relegated to standing outside the decision making process of our national accounting systems, with beggarly hands outstretched, perpetuated by a system of post-colonial/neoliberal donor aid.
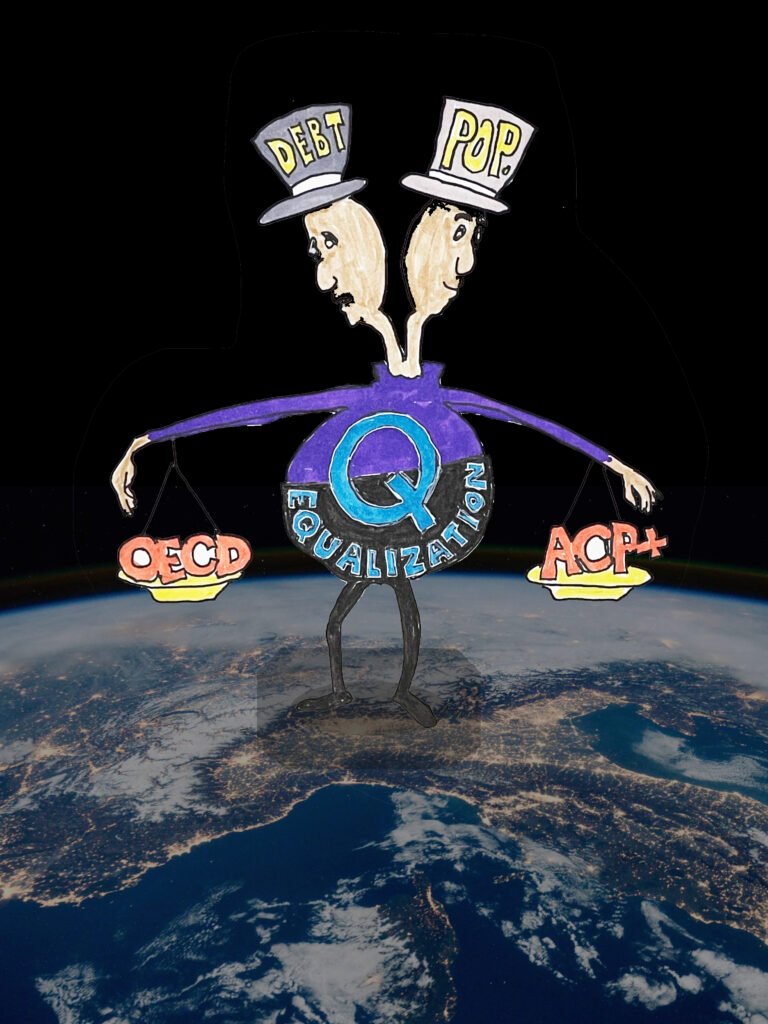
Equalization (Q) was first conceived as a kind of an enhanced ACP-EU agreement where funding for an alternative system could look at a variety of statistical data and equalize how we measure GDP. Access to capital and infrastructure could be implemented by a scheme where the EU might issue the premium, the Asia Infrastructure Investment Bank could create the security and an ACP+ might hold the equity to promote a market for restoring our ecological biodiversity.
Since Covid-19 however, there is no reason, for this agreement to only be applicable to the ACP+ regions. Global ecological and economic conditions are such that other developing countries, indigenous peoples, poor peoples and impacted peoples are equally integrated into the biodiversity of a global system and should be afforded pathways for just, fair, and equitable development and infrastructure based on principles of free, prior and informed consent.
The Covid-19 pandemic has proven that there is an ecological system that we need to integrate with that is far greater in scope than ones constructed by treaties, agreements and conventions.
What climate change and pandemics have in common is that they override our economic and legal systems, proving that our ecological interactions are a greater force that our imposed anthropocentric ones.
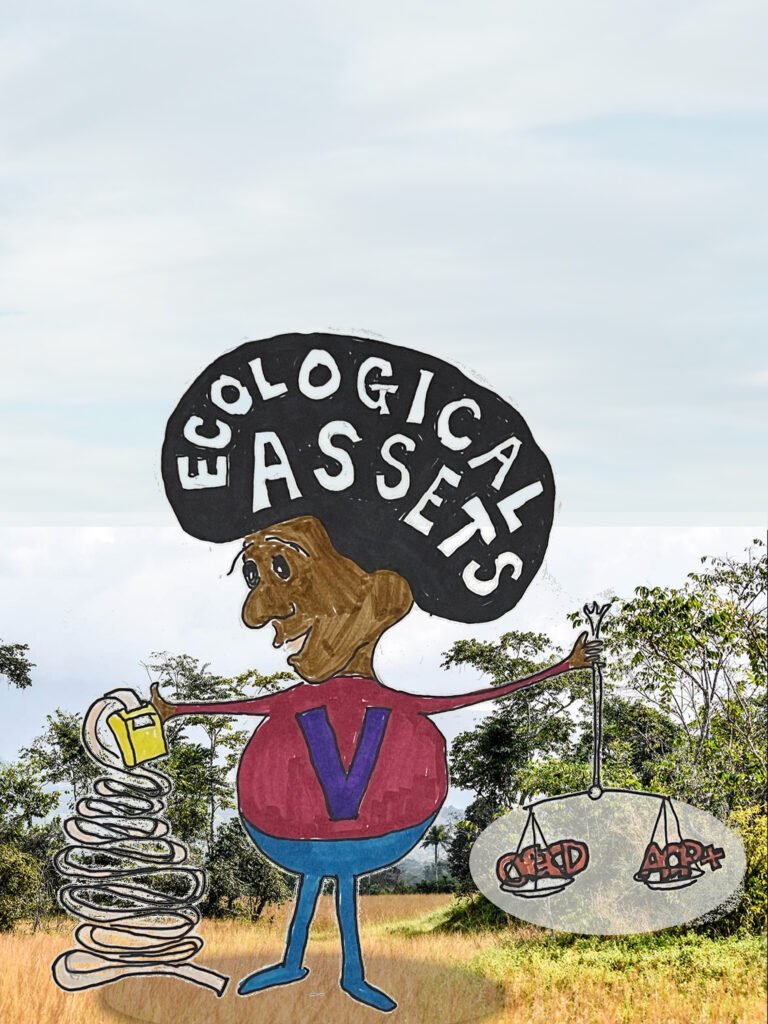
Ecological Assets (V) are what will help to make economies more complete and enhance our Monetary Equivalence Assessment (M∑). Holding the factors of Equalization (Q) and Impact (K) will not only make up for the loss in our Regional Assets (R), but is likely to expand the economic measurements by including the services, technologies and infrastructure addressing Impact, and helping to reduce debt factors caused by imbalances and other post-colonial, neoliberal factors that obstructed the full economic development of countries and peoples and the protections of environments.
Impact factors are likely to enhance how we assess Monetary Equivalence (M∑), and when combined with Equalization factors, our Ecological Assets will attempt to reverse nearly two centuries of industrial greed and malfeasance.
Impact Factors (K) are how we measure and value Carbon PPM reduction (C) and the restoration of our ecological biodiversity, or what we call the Intemerate Offsets (N).
Impact (K) allows economies to transition away from how we value environmental degradation and resource depletion.
Over time, as we balance the initial loss of our Regional Assets (R) with our Ecological Assets (V), economies are likely to modulate upon how we assess monetary equivalence (M∑).
Accounting for Impact (K) factors will result in more equitable investment of labor, goods and services, technologies, infrastructure and R&D targeting restoration and closing the gap in the offsets.
Additionally, the promotion of an Impact (K) table may be leveraged to reduce debt factors caused by imbalances and other post-colonial, neoliberal factors obstructing the full economic development of countries and peoples, and the protections of environments.

The Intemerate Equation is unique in how it accounts for offsets. Offsets of Carbon PPM (parts per million), and the Intemerate Offsets are accounted for separately because Carbon PPM is a globally shared factor, while our Intemerate Offsets are localized to communities, states, or other regional economies.
How Carbon Offsets are measured are by establishing the baseline, which has been set to 350 carbon ppm in our atmosphere. Our global average is reaching 420.
When first developing this equation the Carbon PPM dividend was 412 and the quotient 1.1771. Now the Carbon PPM dividend in 420 and the quotient is 1.2.
As a multiplier to the intemerate offset, the Impact factor (K) amplifies the M∑, increasing the cost of restoration, and decreasing investment returns. Inversely if Carbon PPM were to decrease, it would decrease costs, and increase investment returns.
As long as Carbon is shackled to the cost of Carbon outputs as it is with Cap and Trade schemes, Carbon ppm will continue to be captive to industrial outputs. And while it will provide some revenue to subscribing countries, the data and management of those green and blue protected areas will be accounted for by the industrialized economies, essentially offsetting the cost paid to the host countries. This does little for developing countries and will do little to curb carbon outputs.
Carbon offsets, not carbon outputs.

Central to the Intemerate Equation is how we account for Intemerate Offsets (N).
Rather than placing value only upon what is extracted, used, or consumed as a commodity or an natural capital, intemerate offsets value restoration. If we do not account for restoration as an economic interaction and do not give it a proper value other than being an externality of production or consumption, then it can never be properly valued.
Measurng and accounting for the offsets
We all have the opportunity to measure, to count, to examine, to protect, to nurture, to analyze, to collect, to describe, to compile, to publish, to monitor and manage our environments. This is a service, and it should be accounted for in our national economies. Whether some things can be monetized or not is a technical question, and what that monetary value is may be a personal one, but we live in a global ecomomy and what we do counts.
The Monetary Equivalence Assessment 0r MEA (M∑) is the sum of Regional Assets (R) and Ecological Assets (V). It is not technically a currency, nor is it intended to function as a reserve currency. It is up to Central Banks to determine how that value will be transferred, credited, leveraged, or exchanged.
For example, MEAs might be leveraged as debt by developing countries, or credits for infrastructure. MEAs could also exchanged as digital currency in an index fund or transferred into real cash.
As an accounting index, MEAs are conceived to be a transitional currency index. modulating between GDP and a new accounting side table. How we assess monetary equivalence may change over time, but it is the singular act of realigning our national accounts that will comprehensively restore our ecological biodiversity, reverse climate change and redistribute global wealth.
This video was done in the summer of 2019. While the variables and the equation are the same, some of the details within this equation have evolved and streamlined, especially due to the COVID-19 global economy. For example, we have expanded certain aspects of the Equalization Factor to have broader more international reach with potentially greater cooperation over how this would function within both the OECD and the Global South. While the story has changed, the basic equation has not.
Another video will be produced soon.